Just like Form Statistics, eForm has also introduced statistics shortcodes for showing user performance. You can use them on the user portal page or on sidebars or a dedicated statistics page to give your users charts about how they are performing.
The shortcodes can be found under the eForm Shortcode Builder.
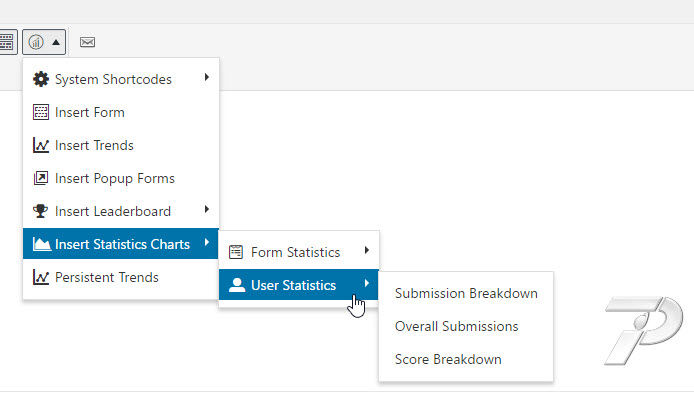
- Open the eForm Shortcode builder.
- Go to Insert Statistics Charts > User Statistics.
- Choose the relevant shortcode.
Like the forms, it also has three variants. All of the statistics charts are responsive, uses Few’s Color Pallet for rendering color. The graphs are made using Chart.js.
Submission Breakdown
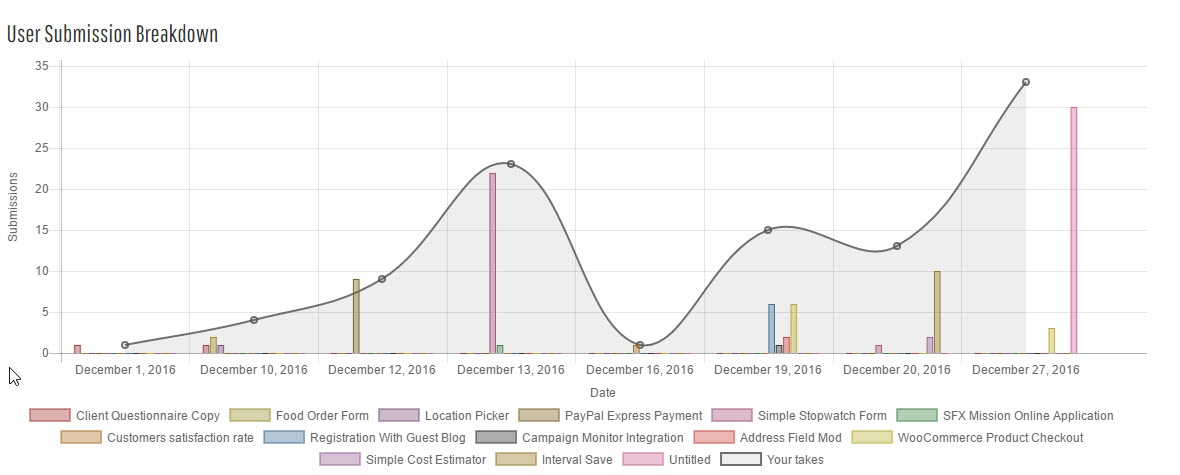
A combo chart to show submission breakdown for selected or current user per day, per form for selected forms. It has the following options.
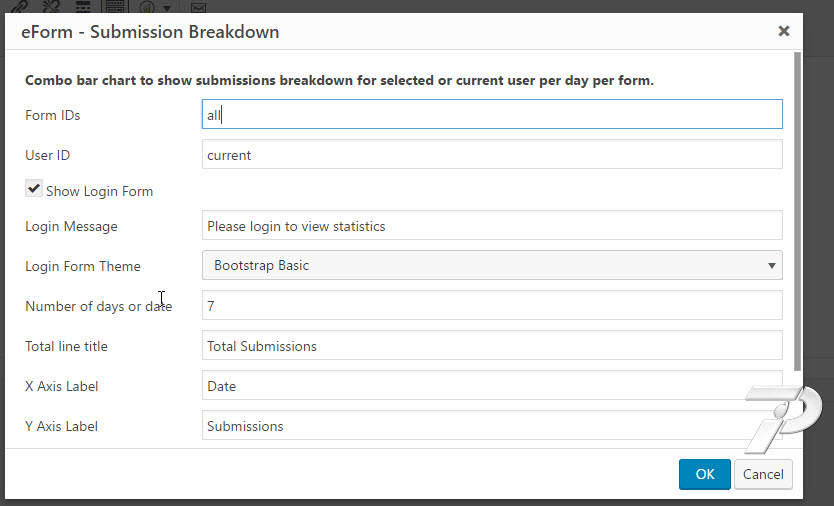
- Form IDs: The numeric IDs of forms. You can have comma separated IDs like
1,12,4,22etc or a single ID like24or all to show forallforms. - User ID: Enter
currentto show for currently logged in user. If not logged in, then nothing would be shown. You can also enter an ID manually to show for a particular user. - Show Login Form: If enabled and stat is being shown for current user, then it will show a login form.
- Login Message: The login form heading.
- Login Form Theme: One of the preset themes for the login form.
- Number of days or date: If you mention an integer, then stat would be generated for past mentioned days since (including) today. If you mention date in
YYYY-MM-DDformat (like2016-12-29for 29th Dec 2016) then stat would be generated since (including) that day. Leave empty to calculate for all time.
You can also change other options to modify chart legends, axes and dimension.
Overall Submission
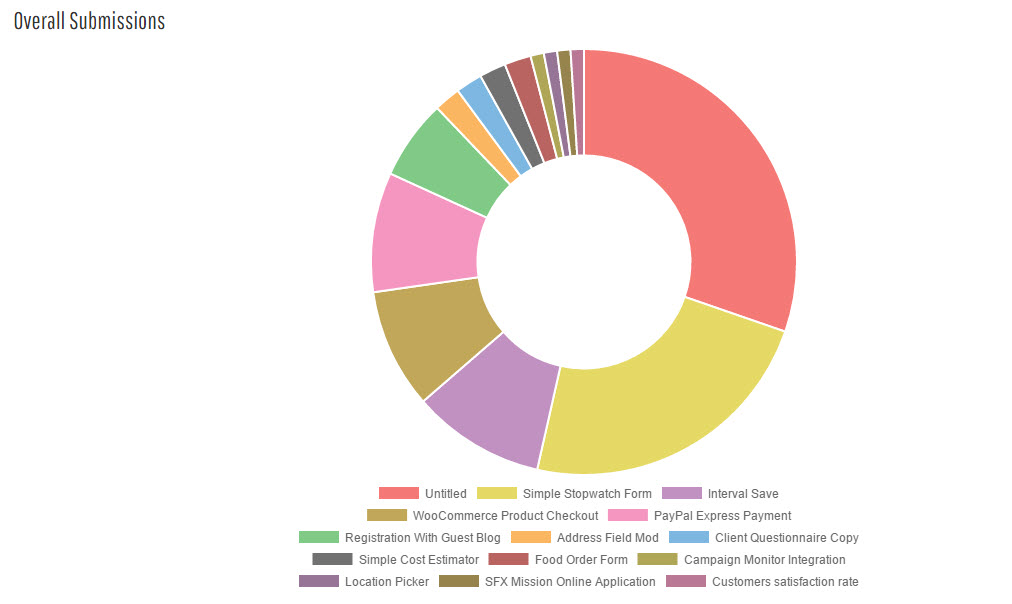
Show overall submission comparison through pie or doughnut chart for current or selected user for selected forms over mentioned time.
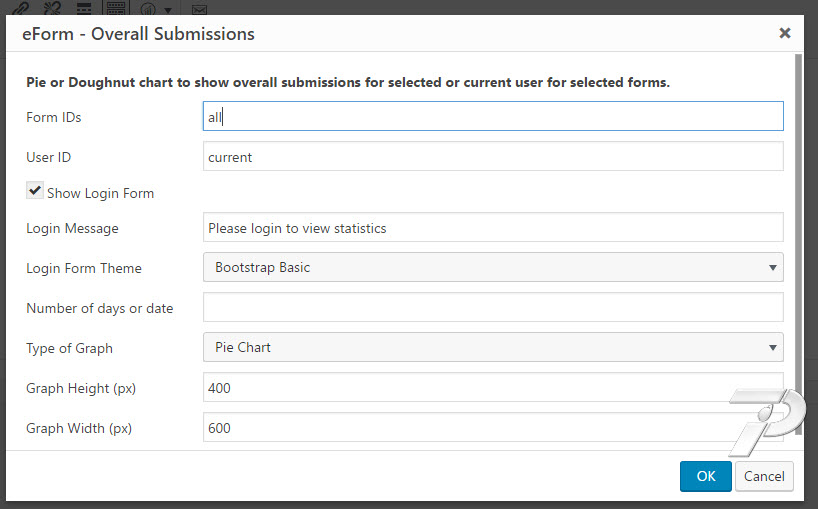
This one has very similar options with one exception of choosing the graph. It can be either Pie or Doughnut Chart.
Score Breakdown
Show percentage score breakdown for current or selected user for selected forms over mentioned time.
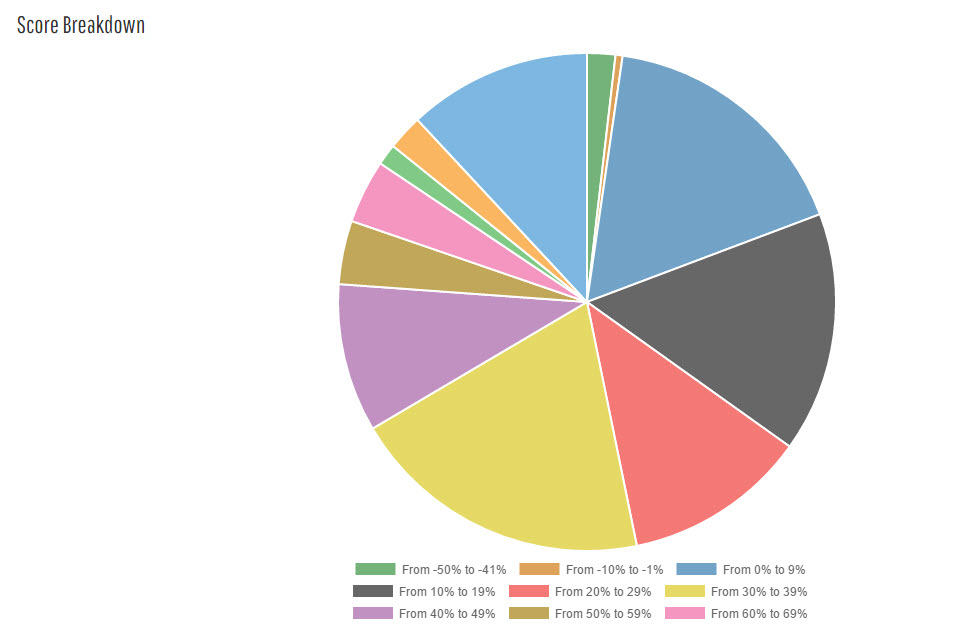
This chart shows score breakdown of mentioned forms. The system generates breakdown in a range of 10, like 0%-9%, 10% – 19% etc, including negatives.

To change the legend, edit the Graph Legend Format option. %1$d%% would be replaced by the lower value of the range, whereas %2$d%% would be replaced by the higher value of the range. Do note that having the percentage sign (%) is also optional. %1$d would simply hold the value, not the percentage sign. Since we want a percentage sign, we add it to the string with an escaped value (%%).
Change other options to modify the charts.