Starting v3.3.0, eForm is eForm (more on this later). What we would discuss now is advanced report and analytics functionality built in eForm.
Accessing the tool
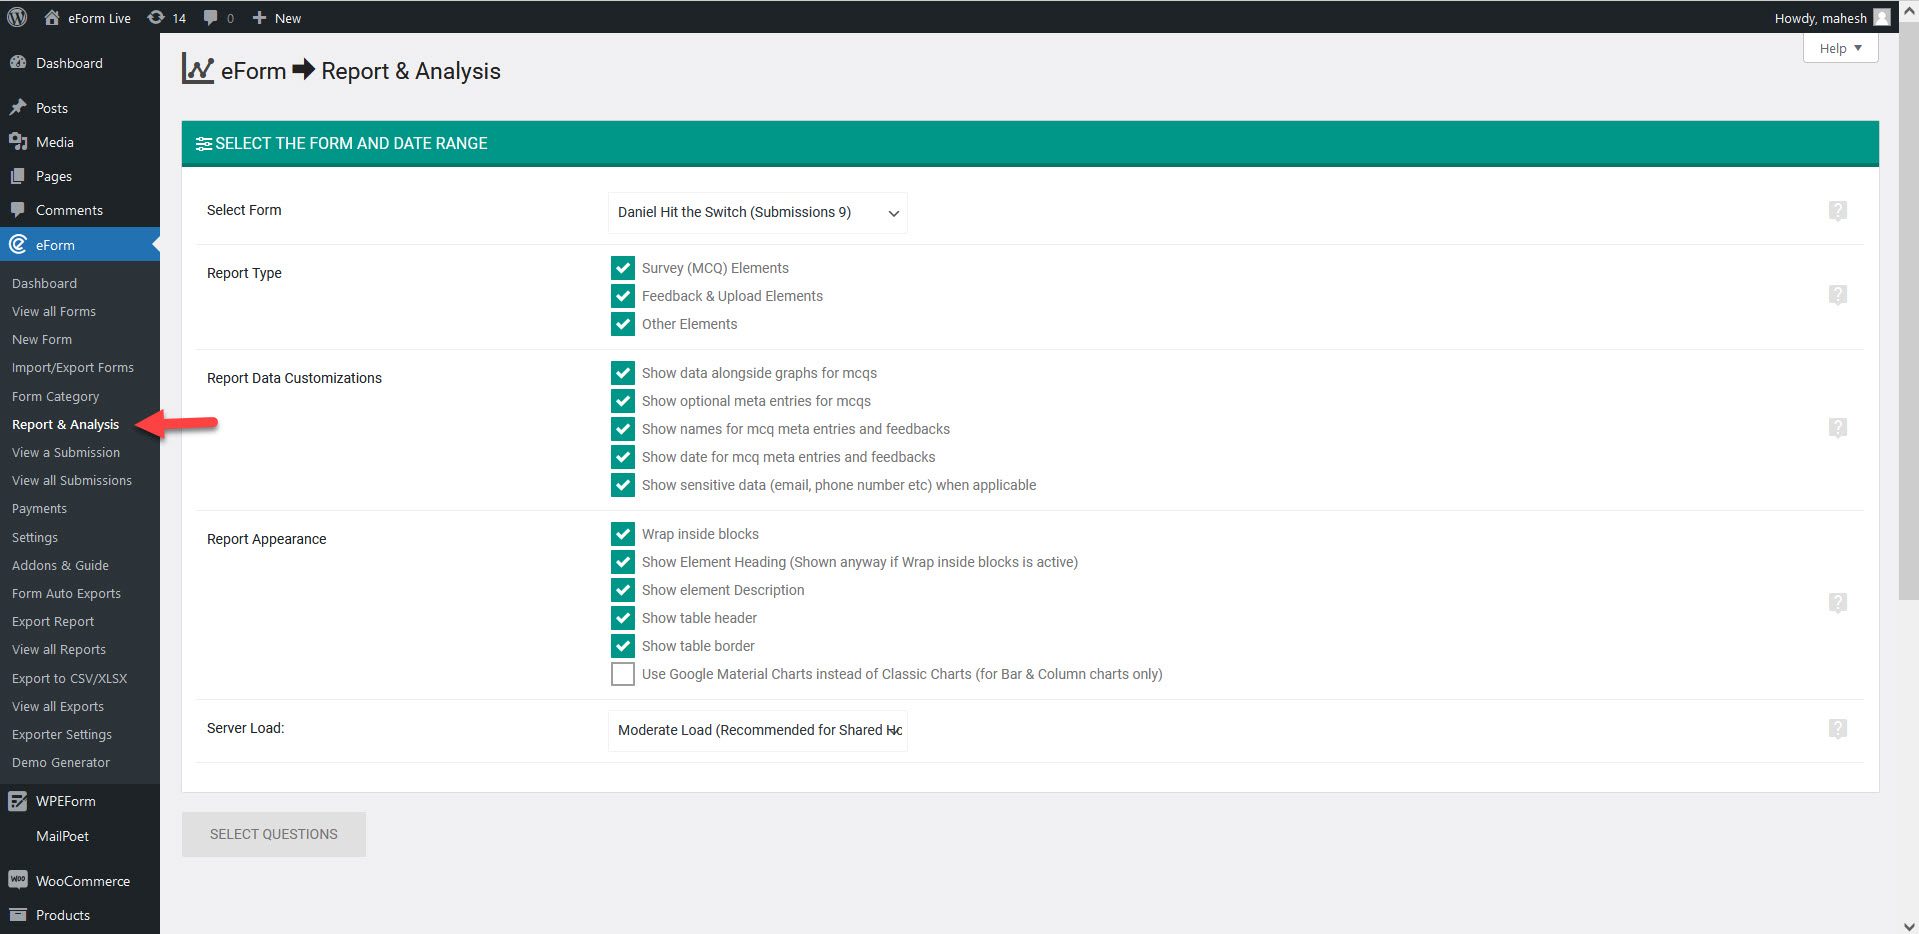
Since the beginning, reports & analytics is available from WP Dashboard > eForm > Report & Analysis. Simply click on the corresponding menu and a page like this will show up.
Report Analysys
Selecting Form & Report Type
The first option of the page would be to select the form for which you want to generate the report. Once done, you will also need to select the types of elements.
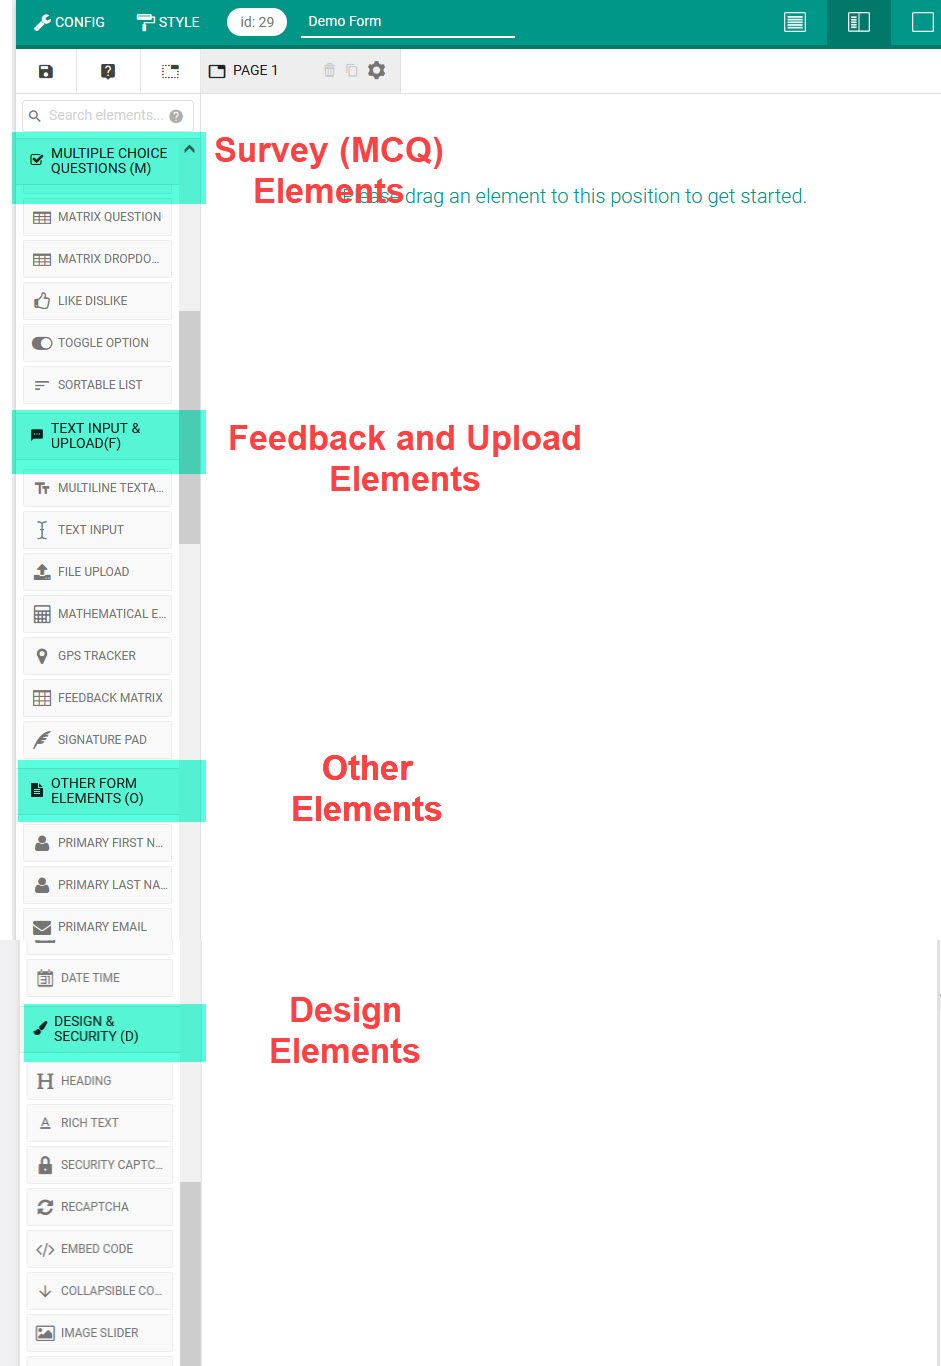
- Survey (MCQ) Elements: The MCQ type elements which you have inserted from (M) section of the form builder.
- Feedback & Upload Elements: The freetype elements which you have inserted from (F) section of the form builder.
- Other Elements: All other elements which you have inserted from (O) section of the form builder.
The reason of such categorizing is simple. In most use cases you’d only want to generate reports against Survey type elements. So we have them pre-categorized for you.
You can select just the type of elements you want and on the next page only relevant elements would appear.
Report Data Customizations
Under this section you will see ample of other options. Use them to change what is displayed along with the charts and how in-depth and sensitive information are handled.
- Show data alongside graphs for mcqs: For MCQs data column would be shown alongside charts.
- Show optional meta entries for mcqs: Show optional text entries for elements like Single Options, Multiple Options, Dropdown, Smiley Rating, LikeDislike etc.
- Show names for mcq meta entries and feedbacks: Show names of contributor/user for form elements (if applicable).
- Show date for mcq meta entries and feedbacks: Show submission date of entries.
- Show sensitive data (email, phone number etc) when applicable: For feedback and some other elements, sensitive data, like email, phone number, link to quick preview etc will be shown.
Report Appearance
Finally some options to change the appearance of reports. This may not come in handy in the admin end, but we will see how it becomes very useful in the frontend (publishing reports in your website).
- Wrap inside blocks: Wrapping inside would print a nice eForm block styled container inside which graphs would be printed.
- Show Element Heading: If disabled then element heading (title) would not be shown. Do note that if you have the Wrap inside blocks enabled, then it has no effect.
- Show element Description: If disabled then element description would not be shown.
- Show table header: If disabled then table headings would not be shown.
- Show table border: If disabled then borderless table would be rendered.
- Use Google Material Charts: Google has released material design for bar and column charts. If you want to show them instead, then enable this option. It has no effect on pie, area and combo charts. Also material charts do not support IE8.
Server Load
The final option is server load. This amounts to the number of data the system would process per AJAX request.
- In most cases Moderate Load would do just fine. It makes the system process 30 data per request.
- If you are on VPS or dedicated server, you can change it to Heavy Load (50 data per request).
- Alternately, if the reporting system fails or gives you AJAX error, try the light load (15 data per request).
That’s all about the first page of the reports wizard. Now we will see how we can customize the charts.