Once you have selected the report type, data and appearance, the screen will prompt you with list of elements (or questions) from the specified types. All elements of the “Survey” type and few of “Other” will show graphs in the report. In the same screen you can modify the types of charts/graphs shown and whether to print the chart title, legends and axis ticks.
- Select a relevant element for which charting is possible.
- It will bring the options panel.
- Set the chart type.
- Additionally set whether to show chart title, legends and ticks.
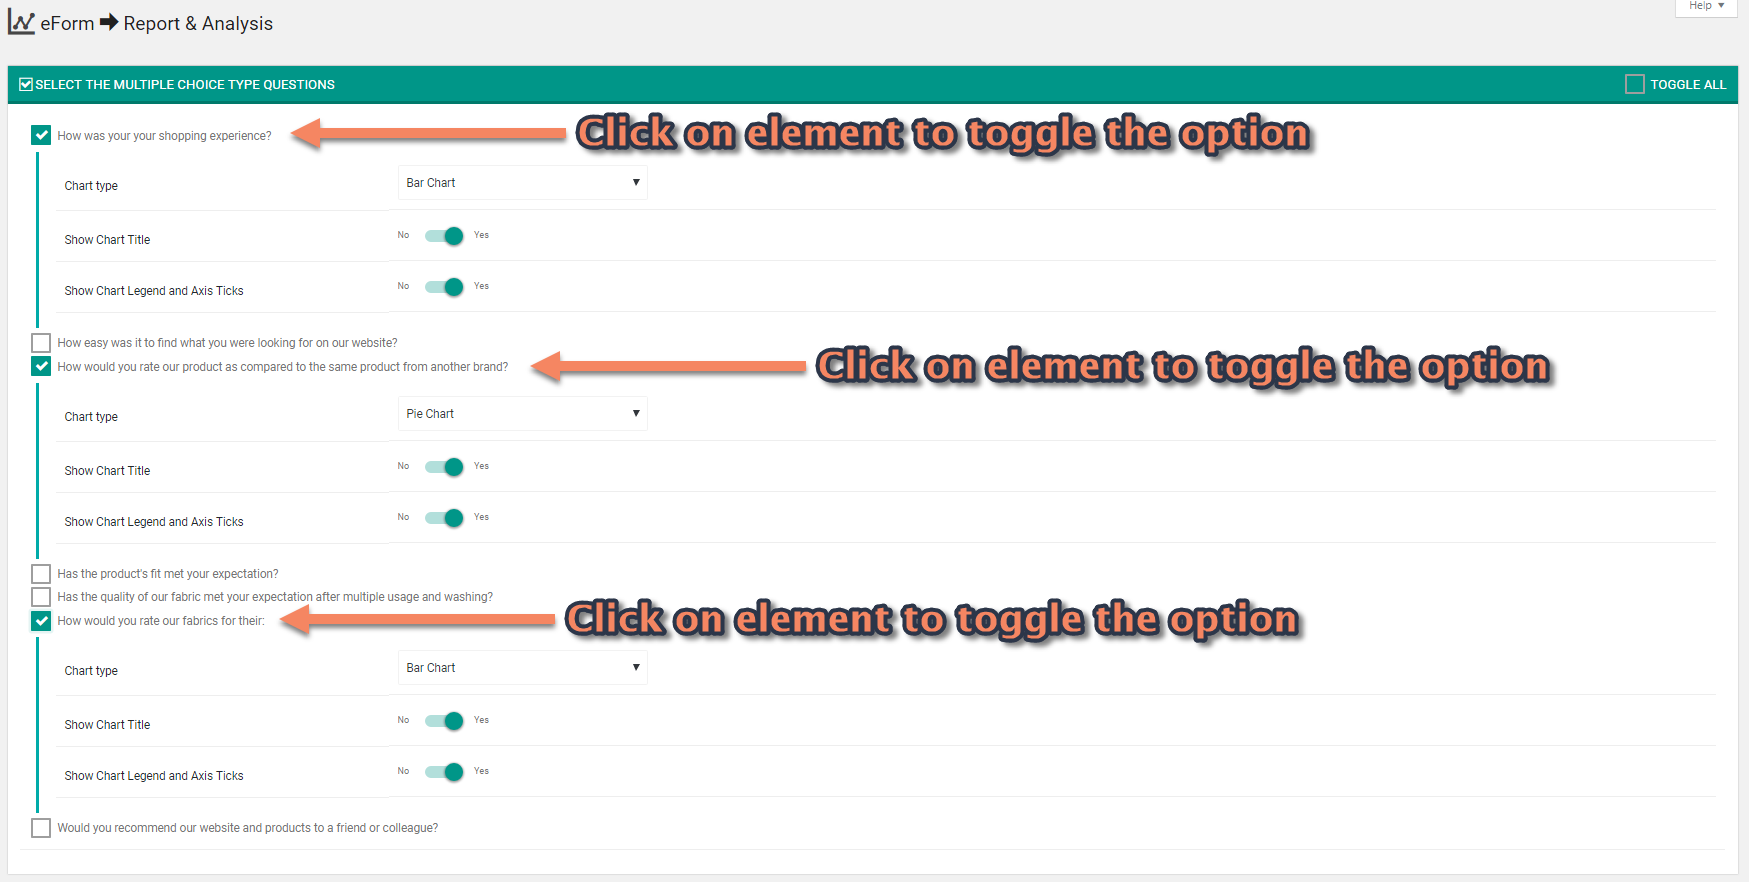
Available chart customization in eForm
All of the options can be modified on per element level. It gives you complete control on how your report will appear.
- Chart type: Here you select the type of the chart the system will draw. Depending on the elements, possible charts are pie, bar, column, stacked bar, stacked column, area and candlestick.
- Show Chart Title: Enable this if you want to print the element title inside the chart. This is useful when showing just the chart in the report.
- Show Chart Legend and Axis Ticks: Enable this if you want to print legends and axis ticks in the chart. If you keep it disabled, then a bare chart will be drawn.
- Percentage Meta Line: In some elements (grading & spinner) the system can show a percentage meta line (for showing average of submissions, more on it later). Do note that if you enable this, the chart type will be set to combo.
Some notes & special cases
- If you select material charts in appearance, then note that only bar and column charts will be rendered this way. Google charts does not support (yet) material design for other charts.
- Combo charts is possible only with Grading & Spinner elements. It is automatically selected when you enable the Percentage Meta Line.
- Different elements have different chart types. For e.g, Stacked Bar and Column is possible only with matrix type elements.
- Feedback and some free input type elements from “Other” category does not have charting option.