Just like Form Statistics, eForm has also introduced statistics shortcodes for showing user performance. You can use them on the user portal page or on sidebars or a dedicated statistics page to give your users charts about how they are performing.
To add a Form Statistics on your post, simply click on the add block button and search for Form Statistics.
Form Submission Breakdown

It shows how many submissions have been made for mentioned forms for past selected days or from the date. The block has following options.
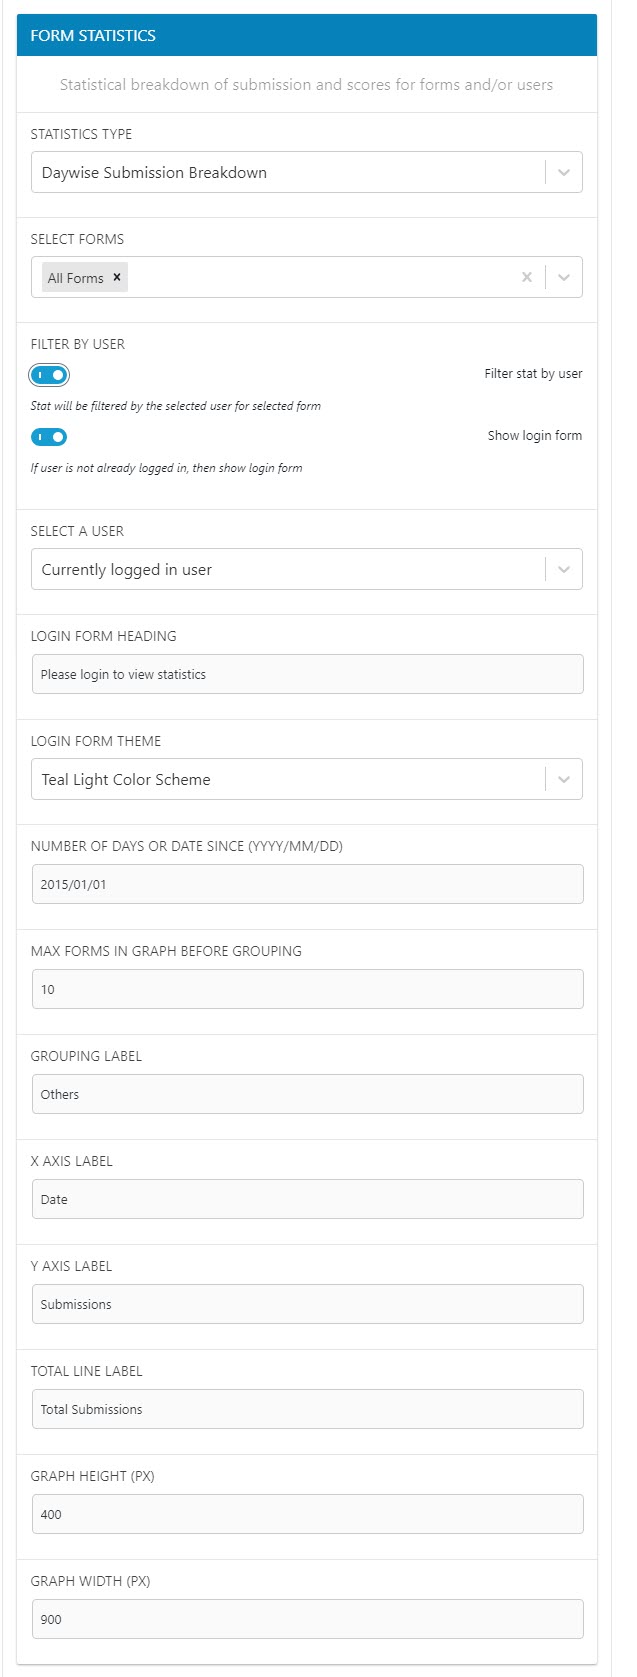
- Form IDs: The numeric IDs of forms. You can have comma separated IDs like
1,12,4,22etc or a single ID like24or all to show forallforms. - Number of days or date: If you mention an integer, then stat would be generated for past mentioned days since (including) today. If you mention date in
YYYY-MM-DDformat (like2016-12-29for 29th Dec 2016) then stat would be generated since (including) that day. Leave empty to calculate for all time.
Other options are quite self-explanatory. Use them to change graph labels, title and dimension.
Overall Submissions
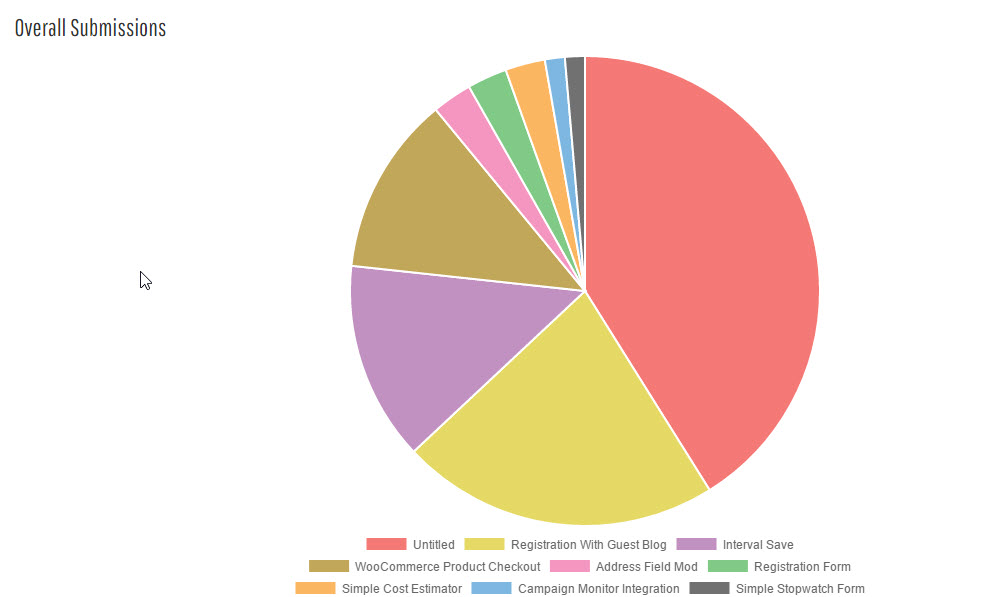
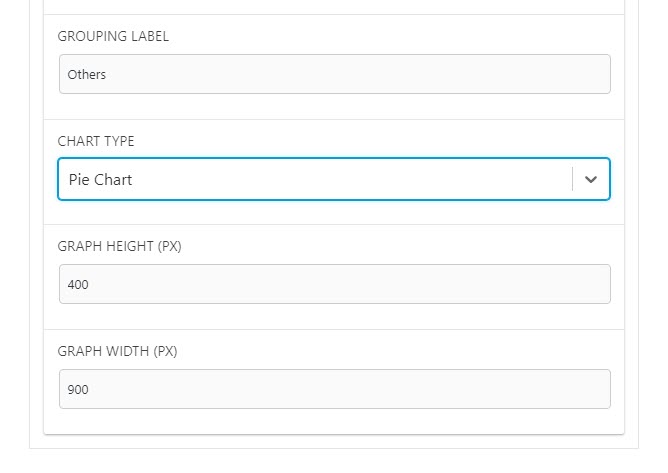
It shows overall submission comparison through a pie or doughnut chart for selected forms over mentioned number of days.
 Score Breakdown
 This chart shows score breakdown of mentioned forms. The system generates breakdown in a range of 10, like 0%-9%, 10% – 19% etc, including negatives.
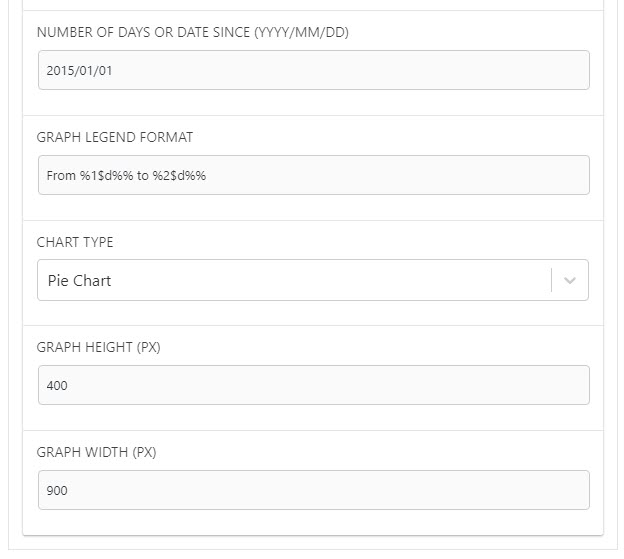
To change the legend, edit the Graph Legend Format option. %1$d%% would be replaced by the lower value of the range, whereas %2$d%% would be replaced by the higher value of the range. Do note that having the percentage sign (%) is also optional. %1$d would simply hold the value, not the percentage sign. Since we want a percentage sign, we add it to the string with an escaped value (%%).
Change other options to modify the charts.